Maps
Addthis
The city recently had an Open Data Challenge to encourage people to use publicly available Boston data. Take a look at my submission, BuildBPS — Exploring Equity, or see some previous mapping projects below.
In order to better understand the current state of students and schools in the city, I have created several maps to visualize some of the data the district has released. BPS divides the city into over 800 "geocodes." On these maps each circle represents the students in one of these geocodes. Larger circles represent more children, while on most maps the darkness or color of the circle shows a characteristic of the children who live in that geocode. Click on the images below to see full-size, interactive maps. Once you've opened the map, click the circles for details for each geocode.
Quality of School Attended
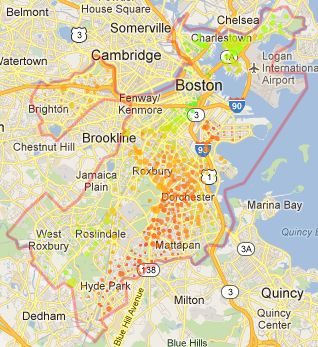
This map shows the average quality of the BPS students living in each geocode. Quality is measured using a single data point which is the BPS MCAS snapshot (more info on this page). I chose this measurement because it is fairly current (covers the last two years) and balances both the MCAS score, and the amount students improved. Also, it is available for almost all BPS schools. Larger circles indicate more students in the geocode. Greener circles indicate that students living in the geocode attend schools with a higher MCAS snapshot, redder circles indicate that students attend schools with lower MCAS snapshots.
Location of Students by School
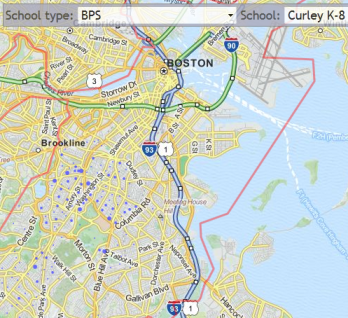 This interactive map allows you to choose a BPS or other school and see where in Boston children who attend the school live. Each circle represents a geocode where students who attend the selected school live. Larger circles represents more students.
Distance from School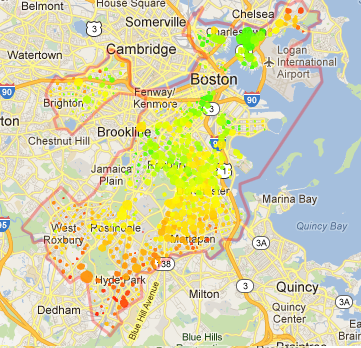
This map shows the average distance from school. Greener circles indicate that students in the geocode live closer to their schools, redder means they live farther from their schools. Are distances are “as the crow flies.”
Non-BPS Students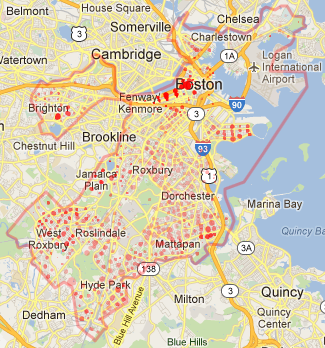
This map shows students who live in Boston, but do not attend a BPS school. Darker red means a higher percentage of students in the geocode attend non-BPS schools. The size of the circle represents the number of non-BPS students in the geocode.